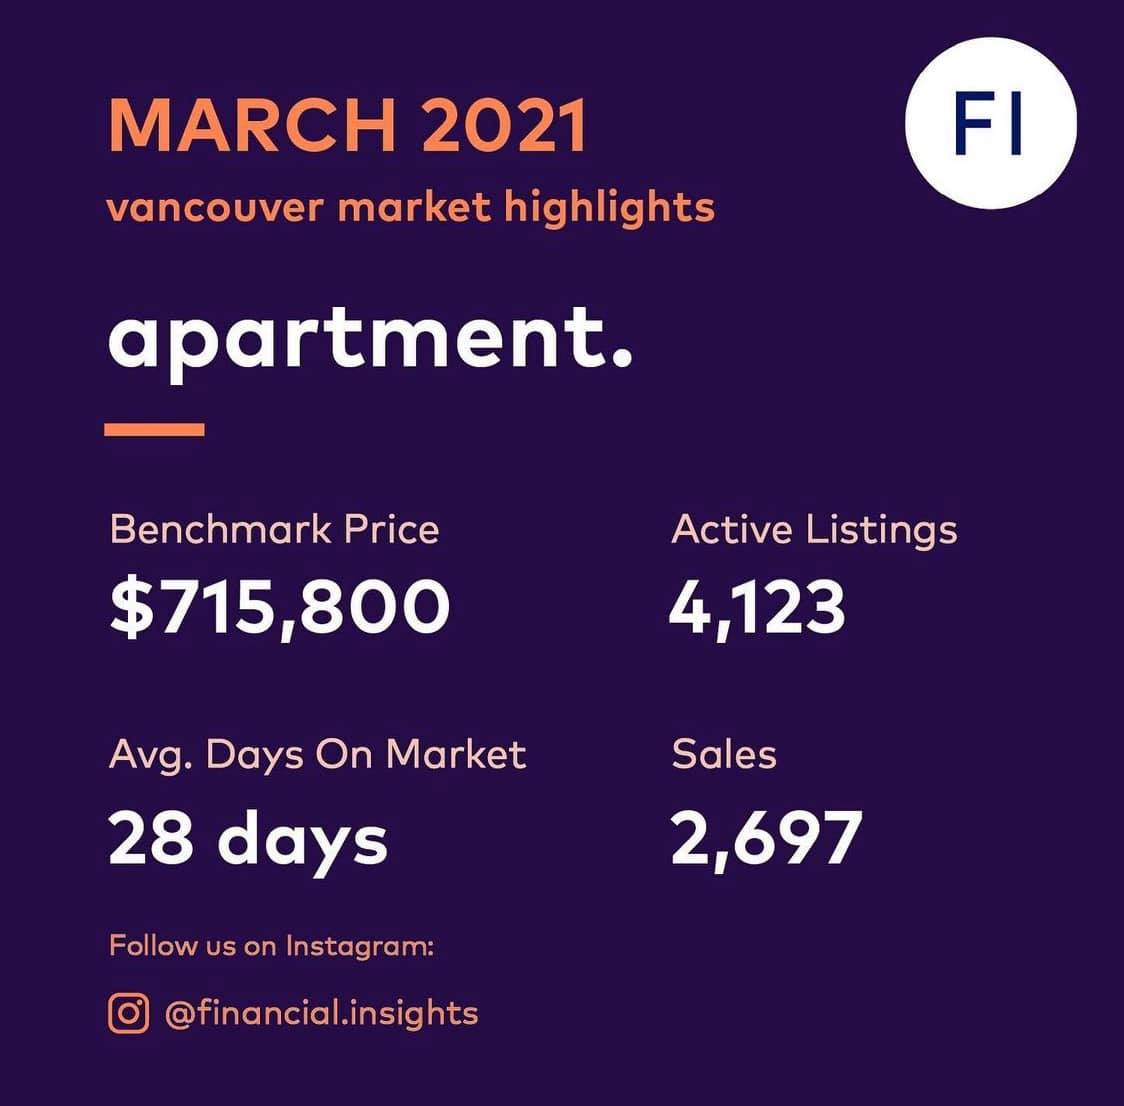
March 2021 Apartment stats..


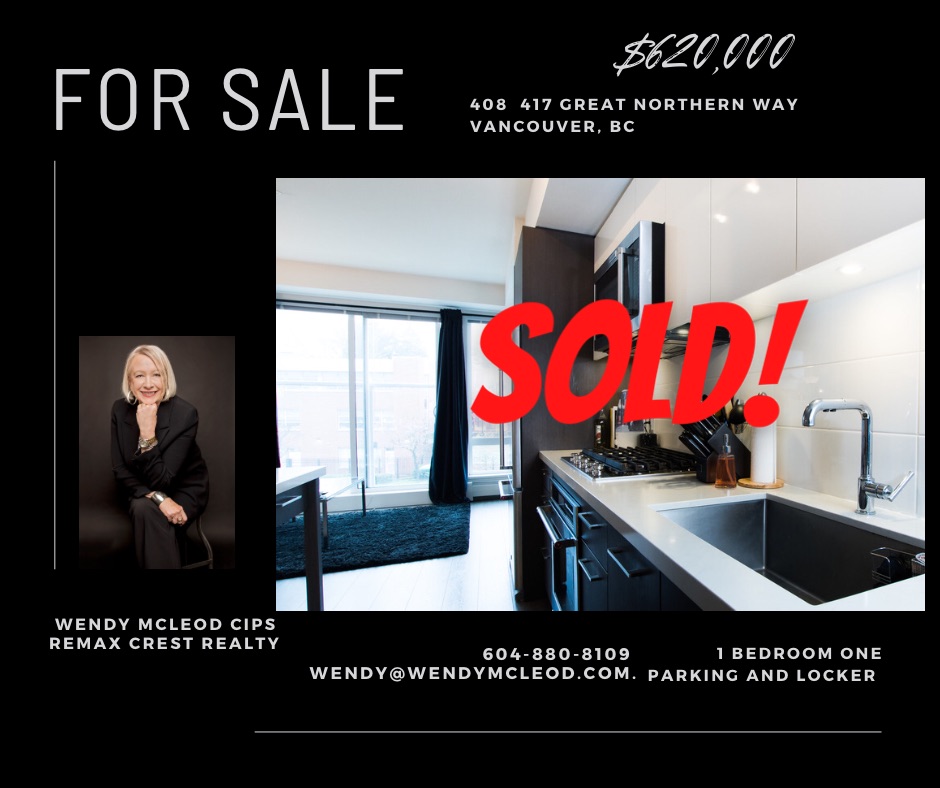
Great area just off Main street
LISTED FOR $620,000
Competition amongst home buyers is putting upward pressure on home prices across Metro Vancouver’s* housing market.
The Real Estate Board of Greater Vancouver (REBGV) reports that residential home sales in the region totalled 3,727 in February 2021, a 73.3 per cent increase from the 2,150 sales recorded in February 2020, and a 56 per cent increase from the 2,389 homes sold in January 2021.
Last month’s sales were 42.8 per cent above the 10-year February sales average.
“Metro Vancouver’s housing market is experiencing seller’s market conditions. The supply of listings for sale isn’t keeping up with the demand we’re seeing,” Colette Gerber, REBGV Chair said. “Competition amongst home buyers is causing multiple offer situations and upward pressure on prices.
“This is particularly true in the townhome market where demand is outstripping the available supply. Conditions differ depending on location and property type so it’s important to work with your local REALTOR® to develop strategies to meet your needs.”
There were 5,048 detached, attached and apartment homes newly listed for sale on the Multiple Listing Service® (MLS®) in Metro Vancouver in February 2021. This represents a 26.1 per cent increase compared to the 4,002 homes listed in February 2020 and a 12.7 per cent increase compared to January 2021 when 4,480 homes were listed.
The total number of homes currently listed for sale on the MLS® system in Metro Vancouver is 8,358, a 9.1 per cent decrease compared to February 2020 (9,195) and a 0.6 per cent increase compared to January 2021 (8,306). This is 21.2 per cent below the February 10-year average for new listings.
For all property types, the sales-to-active listings ratio for February 2021 is 44.6 per cent. By property type, the ratio is 41.8 per cent for detached homes, 61.8 per cent for townhomes, and 41.7 per cent for apartments.
Generally, analysts say downward pressure on home prices occurs when the ratio dips below 12 per cent for a sustained period, while home prices often experience upward pressure when it surpasses 20 per cent over several months.
“Low interest rates remain a key driver in today’s market. We’re seeing steady numbers of first-time home buyers and move-up buyers entering the market,” Gerber said.
The MLS® Home Price Index composite benchmark price for all residential properties in Metro Vancouver is currently $1,084,000. This represents a 6.8 per cent increase over February 2020 and a 2.6 per cent increase compared to January 2021.
Less populated communities within the region continue to experience the largest year-over-year price increases across all property types. Examples, according to the MLS HPI®. include Bowen Island (34.4 per cent increase), the Sunshine Coast (32.7 per cent increase), West Vancouver (16.1 per cent increase) Maple Ridge (14.8 per cent increase) and Ladner (13.7 per cent increase).
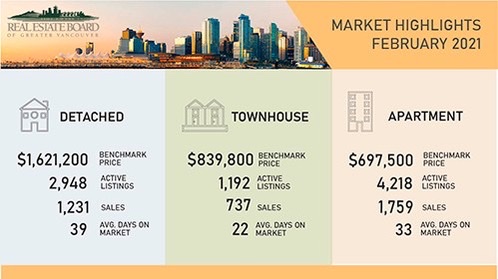
Sales of detached homes in Metro Vancouver reached 1,231 in February 2021, a 79.7 per cent increase from the 685 detached sales recorded in February 2020. The benchmark price for a detached home is $1,621,200. This represents a 13.7 per cent increase from February 2020 and a 2.8 per cent increase compared to January 2021.
Sales of apartment homes reached 1,759 in February 2021, a 65.8 per cent increase compared to the 1,061 sales in February 2020. The benchmark price of an apartment is $697,500. This represents a 2.5 per cent increase from February 2020 and a 2.5 per cent increase compared to January 2021.
Attached home sales in February 2021 totalled 737, an 82.4 per cent increase compared to the 404 sales in February 2020. The benchmark price of an attached home is $839,800. This represents a 7.2 per cent increase from February 2020 and a 2.9 per cent increase compared to January 2021.
Areas covered by the Real Estate Board of Greater Vancouver include: Burnaby, Coquitlam, Maple Ridge, New Westminster, North Vancouver, Pitt Meadows, Port Coquitlam, Port Moody, Richmond, South Delta, Squamish, Sunshine Coast, Vancouver, West Vancouver, and Whistler.
The real estate industry is a key economic driver in British Columbia. In 2020, 30,944 homes changed ownership in the Board’s area, generating $2.1 billion in economic spin-off activity and an estimated 14,728 jobs. The total dollar value of residential sales transacted through the MLS® system in Greater Vancouver totalled $33.7 billion in 2020.
Craig Munn
Director, Communication
Real Estate Board of Greater Vancouver
604.730.3146
cmunn@rebgv.org

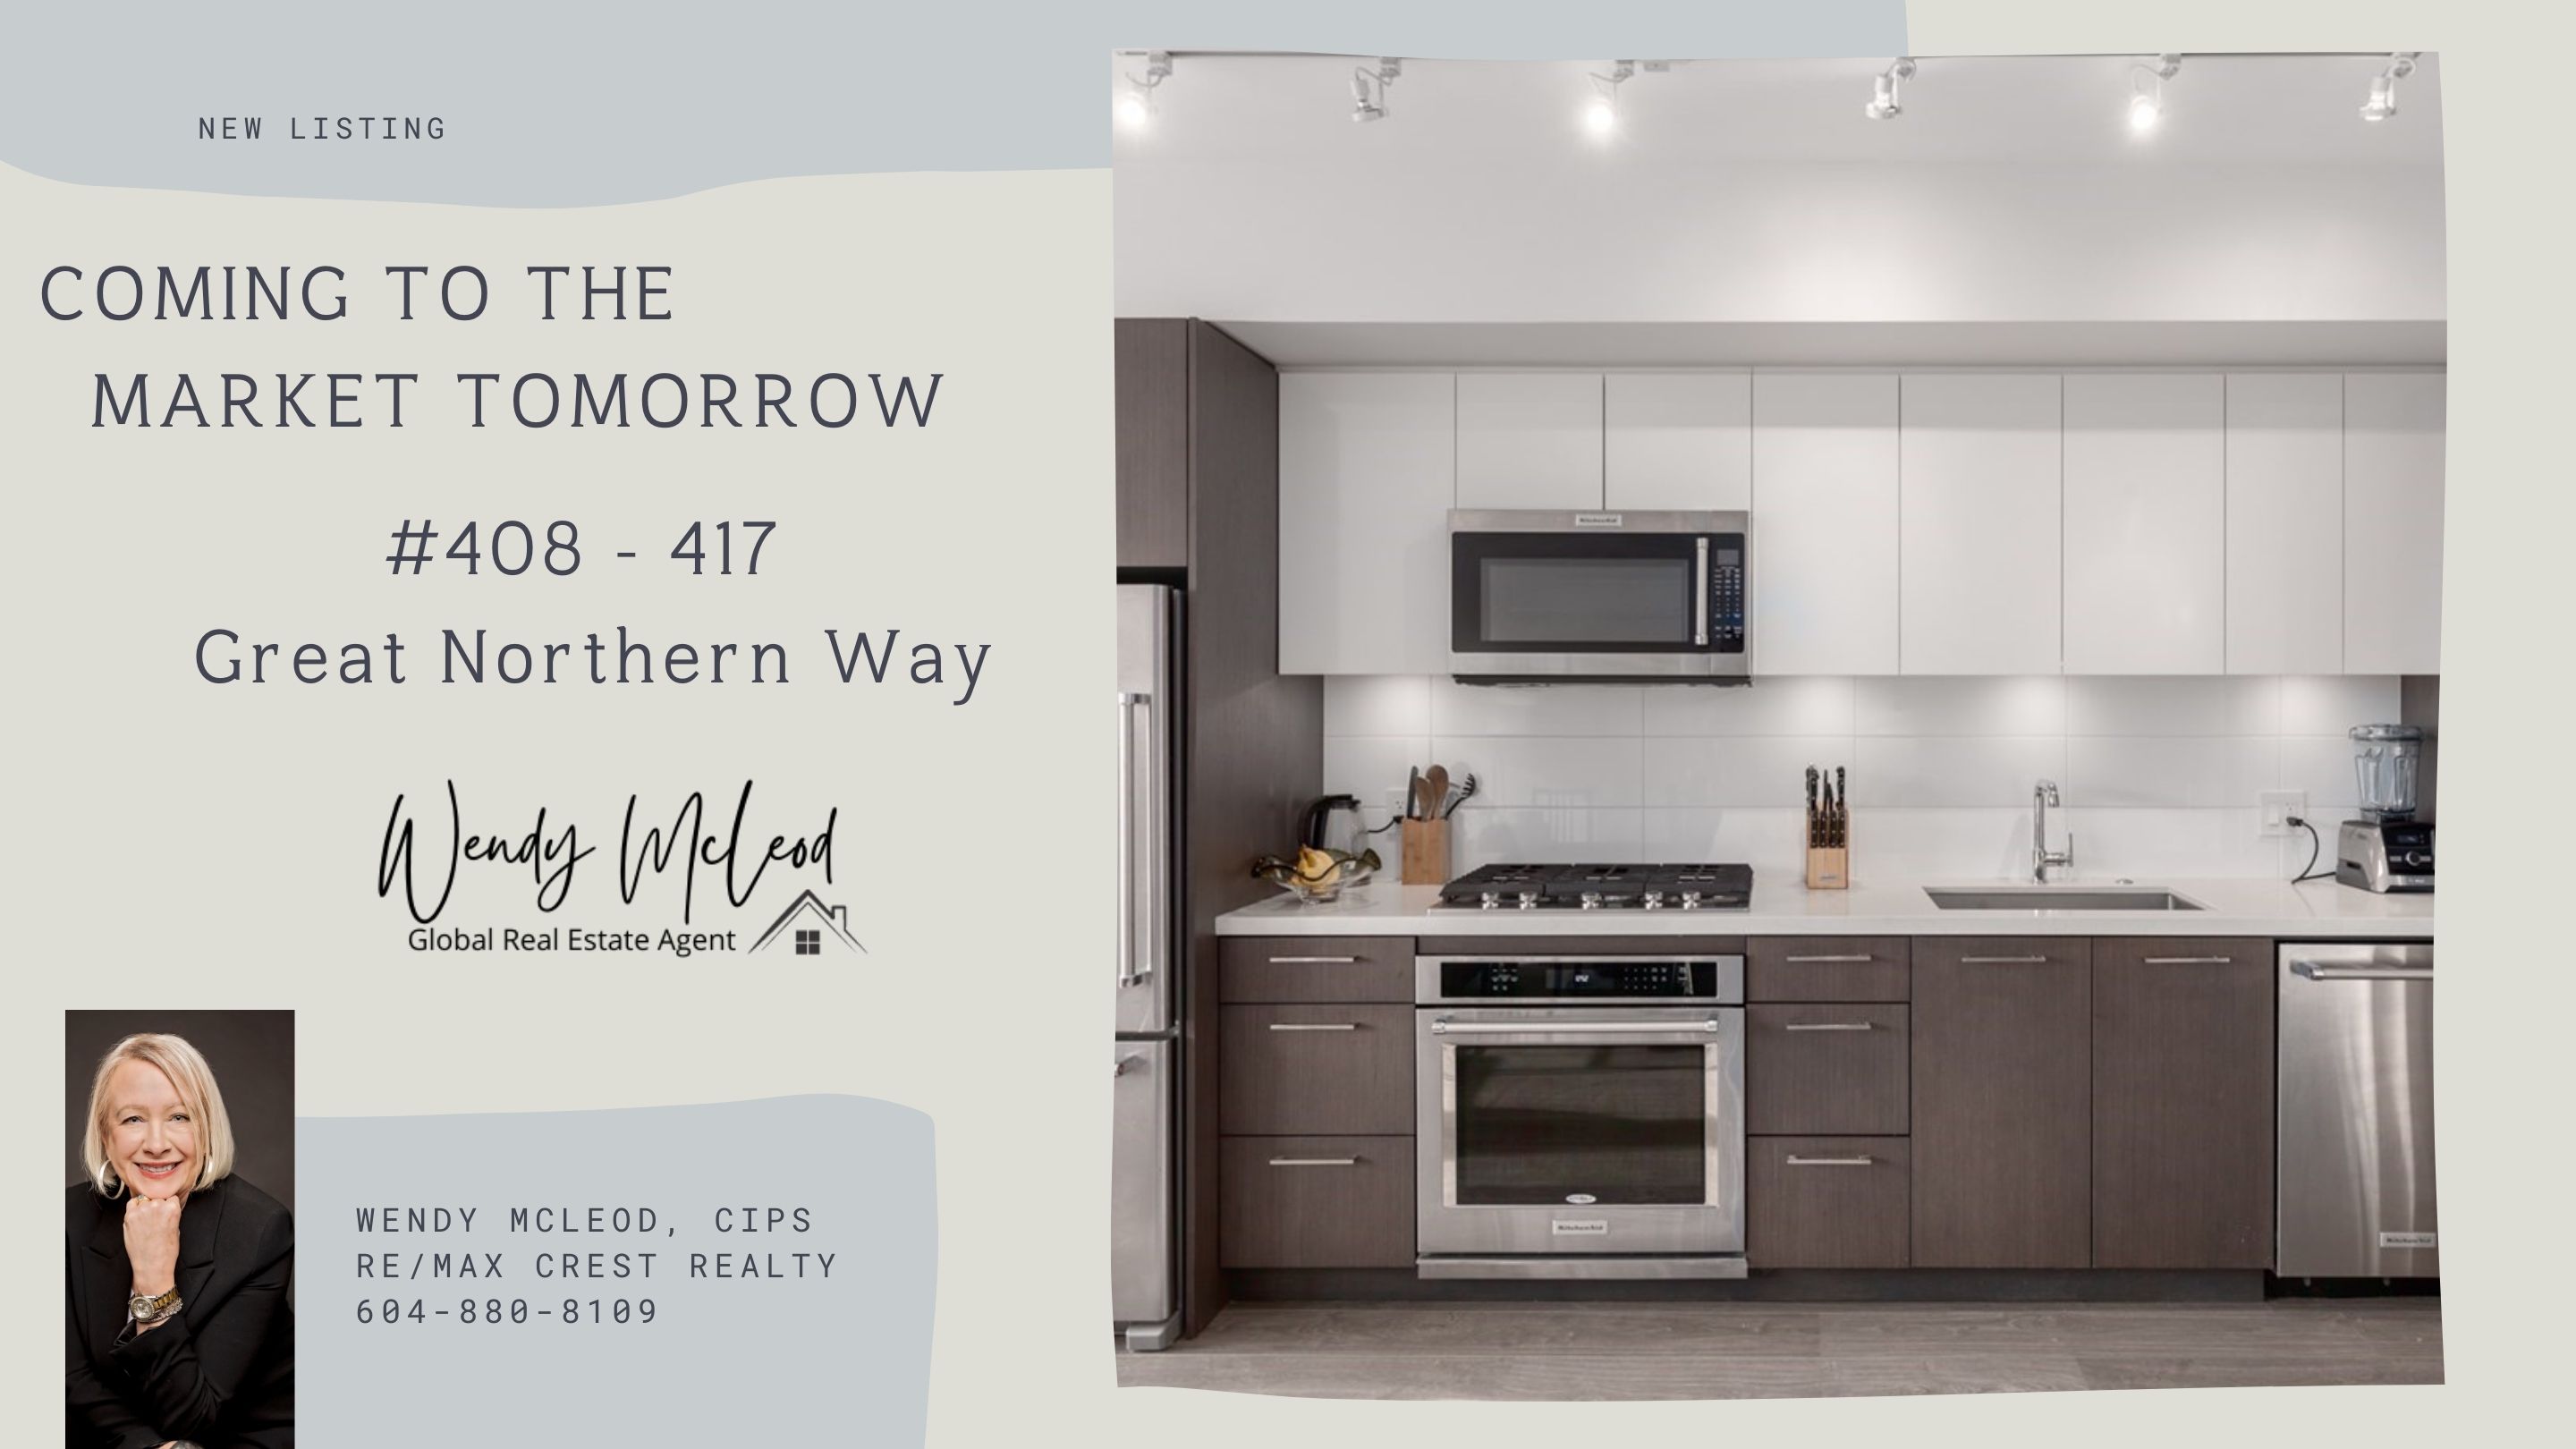
COMING TO THE MARKET TOMORROW, THIS GREAT ONE BEDROOM, SUNNY BRIGHT CONDO. ONE
PARKING, STORAGE, GREAT AMENITIES.
$620,000

Strong December activity brought Metro Vancouver’s* 2020 home sales total in line with the region’s long-term annual average.
The Real Estate Board of Greater Vancouver (REBGV) reports that residential home sales in the region totalled 30,944 in 2020, a 22.1 per cent increase from the 25,351 sales recorded in 2019, and a 25.7 per cent increase from the 24,619 homes sold in 2018.
Last year’s sales total was 2.8 per cent below the 10-year sales average.
“When the pandemic began in March, the housing market came to a near standstill. We knew, however, that shelter needs don’t go away in times of crisis, they intensify," Colette Gerber, REBGV Chair said. “The real estate community worked closely with our regulatory bodies and public health officials in the spring to ensure appropriate precautions and protocols were implemented so BC REALTORS® could help residents safely meet their housing needs."
Home listings on the Multiple Listing Service® (MLS®) in Metro Vancouver reached 54,305 in 2020. This is a 4.6 per cent increase compared to the 51,918 homes listed in 2019 and a 1.3 per cent increase compared to the 53,614 homes listed in 2018.
Last year’s listings total was 2.7 per cent below the region’s 10-year average.
“After adapting to the COVID-19 environment, local home buyer demand and seller supply returned at a steady pace throughout the summer, fall and winter seasons," Gerber said. "Shifting housing needs and low interest rates were key drivers of this activity in 2020. Looking ahead, the supply of homes for sale will be a critical factor in determining home price trends in 2021.”
The MLS® HPI composite benchmark price for all residential properties in Metro Vancouver ends the year at $1,047,400. This is a 5.4 per cent increase compared to December 2019.
The benchmark price for apartments increased 2.6 per cent in the region last year. Townhomes increased 4.9 per cent and detached homes increased 10.2 per cent.
REBGV reports that residential home sales in the region totalled 3,093 in December 2020, a 53.4 per cent increase from the 2,016 sales recorded in December 2019, and a 0.9 per cent increase from the 3,064 homes sold in November 2020.
Last month’s sales were 57.7 per cent above the 10-year December sales average and is the highest total for the month on record.
“Robust December sales outpaced long-term averages in what’s traditionally the quietest month of the year in real estate. This was part of an unusual seasonal pattern the market followed last year, which can be attributed in large part to the pandemic,” Gerber says.
There were 2,409 detached, attached and apartment properties newly listed for sale on the MLS® in Metro Vancouver in December 2020. This represents a 51.7 per cent increase compared to the 1,588 homes listed in December 2019 and a 40.8 per cent decrease compared to November 2020 when 4,068 homes were listed.
The total number of homes currently listed for sale on the MLS® system in Metro Vancouver is 8,538, a 0.8 per cent decrease compared to December 2019 (8,603) and a 23.2 per cent decrease compared to November 2020 (11,118).
For all property types, the sales-to-active listings ratio for December 2020 is 36.2 per cent. By property type, the ratio is 35.2 per cent for detached homes, 50.4 per cent for townhomes, and 33.1 per cent for apartments.
Generally, analysts say downward pressure on home prices occurs when the ratio dips below 12 per cent for a sustained period, while home prices often experience upward pressure when it surpasses 20 per cent over several months.
Sales of detached homes in December 2020 reached 1,026, a 71.3 per cent increase from the 599 detached sales recorded in December 2019. The benchmark price for detached homes is $1,554,600. This represents a 10.2 per cent increase from December 2019 and a one per cent increase compared to November 2020.
Sales of apartment homes reached 1,474 in December 2020, a 40 per cent increase compared to the 1,053 sales in December 2019. The benchmark price of an apartment property is $676,500. This represents a 2.6 per cent increase from December 2019 and is unchanged from November 2020.
Attached home sales in December 2020 totalled 593, a 62.9 per cent increase compared to the 364 sales in December 2019. The benchmark price of an attached home is $813,900. This represents a 4.9 per cent increase from December 2019 and a 0.1 per cent decrease compared to November 2020.
Areas covered by the Real Estate Board of Greater Vancouver include: Burnaby, Coquitlam, Maple Ridge, New Westminster, North Vancouver, Pitt Meadows, Port Coquitlam, Port Moody, Richmond, South Delta, Squamish, Sunshine Coast, Vancouver, West Vancouver, and Whistler.
The Real Estate Board of Greater Vancouver is an association representing more than 13,700 REALTORS® and their companies. The Board provides a variety of member services, including the Multiple Listing Service®. For more information on real estate, statistics, and buying or selling a home, contact a local REALTOR® or visit www.rebgv.org.
Craig Munn
Director, Communication
Real Estate Board of Greater Vancouver
604.730.3146
cmunn@rebgv.org
